
COMPARING ENGAGEMENT METRICS
Engagement Rate vs. Bounce Rate
While bounce rate measures single-page visits, engagement rate provides deeper insights into how users interact with your content. contentEnhance helps track and improve engagement metrics to enhance user experience and SEO performance.
Sign up free
Understanding the Metrics
Engagement rate and bounce rate are two important metrics for measuring website performance, but they tell very different stories about user behavior.
Bounce Rate
Bounce rate represents the percentage of visitors who leave your website after viewing only one page without any interaction. This metric was first introduced by Google Analytics in 2005 and quickly became a standard KPI for measuring website performance. While this metric has traditionally been important, it has several technical and practical limitations:
- It doesn't tell you how long users spent on the page because it relies on comparing timestamps between pageviews - with single-page visits, there is no second pageview to compare against
- It doesn't account for single-page visits where users found what they needed, such as contact information or a specific article, making it potentially misleading for informational content
- It can be misleading for blogs and landing pages where single-page sessions are normal and even expected
- The metric is binary (bounce or no bounce) and doesn't capture partial engagement or micro-interactions
- Traditional bounce rate calculation doesn't consider modern web behaviors like infinite scroll or single-page applications
These limitations have led many organizations to shift focus toward more nuanced engagement metrics that better reflect actual user behavior and content value.
Engagement Rate
Engagement rate emerged as a key metric around 2015 when Google Analytics started tracking more sophisticated user interactions beyond simple pageviews. The concept gained further prominence in 2020 when Google announced GA4, which made engagement the central focus of web analytics.
Engagement rate is technically measured through a combination of factors:
- Session duration calculation: Unlike bounce rate, engagement time is measured through actual user interactions and JavaScript events, providing a more accurate picture of time spent
- Interaction tracking: The system records specific events like:
- Mouse movements and clicks
- Keyboard actions
- Scroll depth measurements
- Video plays and interactions
- Form interactions
- Custom event triggers
Technical Implementation
Modern engagement tracking typically uses these methods:
- Event listeners: JavaScript code that monitors user actions in real-time
- Heartbeat pings: Regular signals sent to analytics servers to confirm active engagement
- Visibility API: Browser-based tracking of whether content is actually visible to users
- Intersection Observer: Advanced API that tracks which elements are in the viewport
- Custom triggers: Site-specific events that indicate meaningful engagement
Calculation Methods
Engagement rate is typically calculated using this formula:
Engagement Rate =𝑬𝒏𝒈𝒂𝒈𝒆𝒅 𝑺𝒆𝒔𝒔𝒊𝒐𝒏𝒔 ÷ 𝑻𝒐𝒕𝒂𝒍 𝑺𝒆𝒔𝒔𝒊𝒐𝒏𝒔 × 100
Where an "engaged session" is defined by meeting one or more of these criteria:
- Active engagement time exceeds a certain threshold (typically 10 seconds)
- Multiple page views or screens in a single session
- At least one conversion event
- Two or more meaningful interactions with the page
This more sophisticated approach provides a much richer understanding of user behavior compared to the binary nature of bounce rate measurements.
Why Engagement Rate Matters More
In 2025, engagement rate has become increasingly important for several key reasons:
- Better User Understanding:
- Provides granular insights into content consumption patterns
- Reveals which sections of content receive the most attention
- Shows how users navigate through long-form content
- Identifies points where users become most engaged
- SEO Impact:
- Search engines now use engagement metrics as ranking signals
- Higher engagement correlates with better SERP positions
- Google's helpful content update emphasizes user satisfaction
- Engagement signals help differentiate quality content from AI-generated content
- Content Quality Indicator:
- High engagement rates validate content relevance
- Shows whether content matches user intent
- Identifies successful content formats and structures
- Helps measure content effectiveness across different audience segments
- Business Value:
- Engaged users show higher conversion rates
- Increased likelihood of return visits
- Better brand recognition and recall
- Higher probability of social sharing and organic promotion
- Competitive Advantage:
- Helps identify content gaps in your market
- Enables data-driven content optimization
- Supports strategic content planning
- Guides resource allocation for content improvement
- User Experience Optimization:
- Identifies potential UX issues
- Highlights successful content structures
- Shows where users encounter friction
- Guides multimedia and interactive element placement
- Content ROI Measurement:
- Provides clear metrics for content performance
- Helps justify content marketing investments
- Enables better resource allocation
- Supports data-driven content strategy decisions
A modern approach to SEO
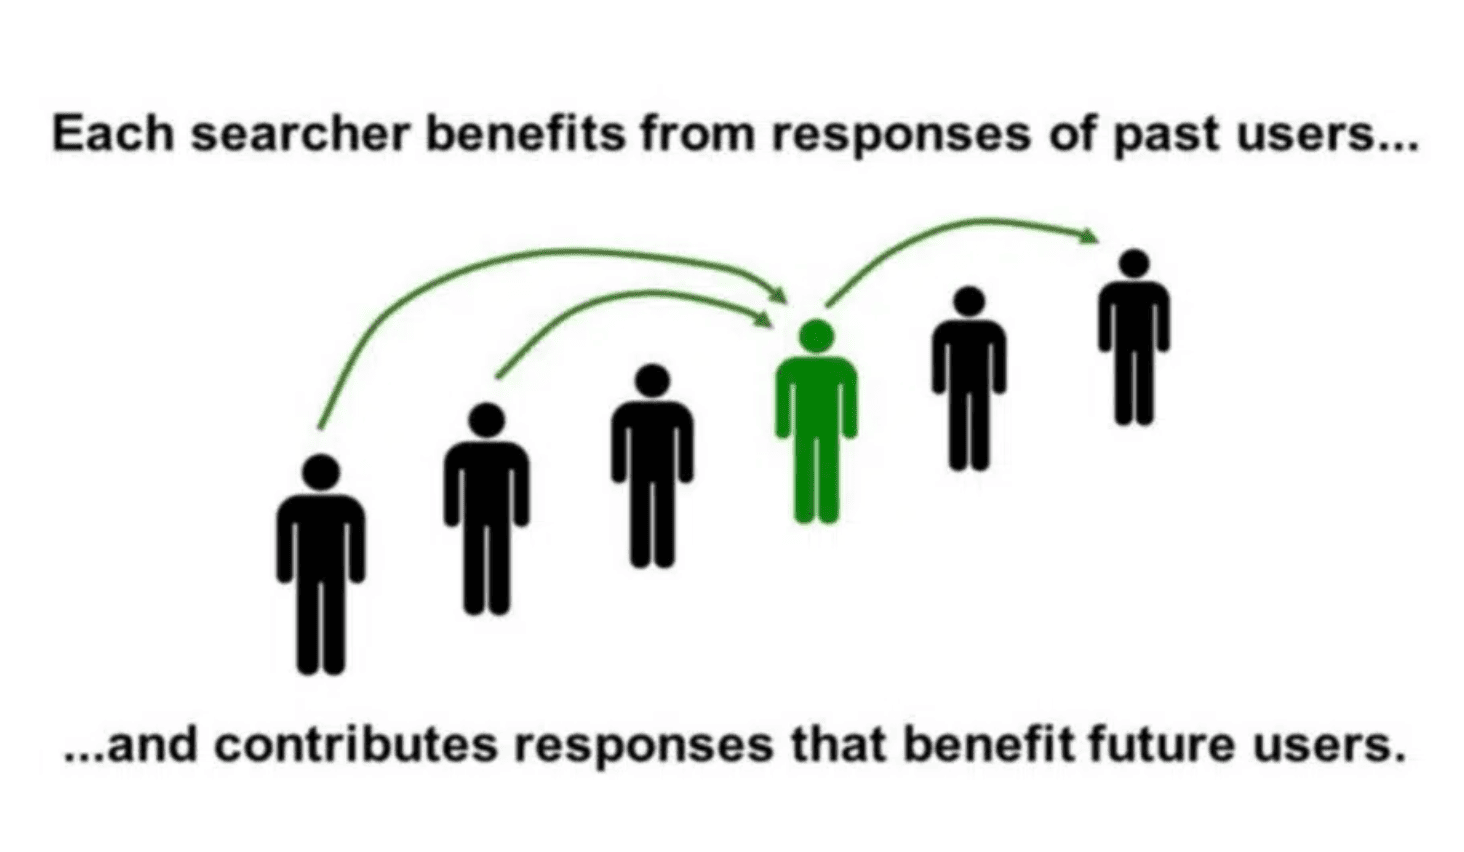
Google has long since used signals such as how often users return to the search results from a page to determine how useful it is. By improving metrics like engagement time and engagement time you will not only be more useful to your users, but also giving the right signals to search engines, resulting in better SEO performance.
Read moreTracking Engagement with contentEnhance
contentEnhance provides several key features to help you track and optimize engagement:
Analytics Dashboard
- Engagement Metrics: Monitor engagement rates, time on page, and interaction patterns
- Trend Analysis: Track engagement changes over time with interactive graphs and visualizations
- Segment Analysis: Break down engagement by traffic source
Example Sessions vs. Engagement Bar Chart
Automated Recommendations
- Content Structure Suggestions: AI-driven recommendations for improving content layout
- Engagement Optimization Tips: Specific actions to increase user interaction
- Content Gap Analysis: Identification of missing elements that could boost engagement
Performance Monitoring
- Chasnge Point Detection Notifications for significant engagement changes
- Entry Point Analysis: Understanding how users discover your content
- Impact Assessment: Measure how content improvements affect key metrics
These tools work together to provide a comprehensive view of content performance and actionable insights for improvement. By leveraging contentEnhance's features, content teams can make data-driven decisions to optimize engagement and deliver better user experiences.
Making the Transition
While bounce rate shouldn't be completely ignored, focusing on engagement metrics provides a more accurate picture of content performance. contentEnhance helps you:
- Identify high-traffic pages with low engagement
- Generate specific recommendations for improvement
- Track the impact of content enhancements
- Take an audience-first approach to content optimization
By shifting focus from bounce rate to engagement metrics, you can better align your content strategy with both user needs and search engine requirements, leading to improved performance across all channels.
Choose your plan
Taster
- 1 user
- 1 project
- GA4 and GSC connection
- Import up to 250 URLs per day
- 2 enhance plan URLs including AI recommendations
- Daily metric update & storage for 7 days
- Journey flow visualisation for each URL
- Task manager
- Daily URL snapshots for 7 days
- Task completion annotations
- Automatic redirect detection
- Generate support for 5 recommendations - one off
Individual
- 1 user
- 3 projects
- GA4 and GSC connection
- Import up to 500 URLs per day
- 50 enhance plan URLs including AI recommendations
- Daily metric update & storage forever
- Journey flow visualisation for each URL
- Task manager
- Daily URL snapshots forever
- Task completion annotations
- Automatic redirect detection
- 5 URL substitutions per month
- 5 URL recommendation refreshes per month
- Generate support for 50 recommendations per month
Team
- 5 users
- 10 projects
- GA4 and GSC connection
- Import up to 1000 URLs per day
- 250 enhance plan URLs including AI recommendations
- Daily metric update & storage forever
- Journey flow visualisation for each URL
- Task manager
- Daily URL snapshots forever
- Task completion annotations
- Automatic redirect detection
- 25 URL substitutions per month
- 25 URL recommendation refreshes per month
- Generate support for 250 recommendations per month